In the early 1940s, while the world was still deeply embroiled in WWII, DuPont established a Post War Planning Division that sought to prepare the company for the war’s eventual conclusion. Peacetime would inevitably alter the landscape of industrial production in the U.S. and beyond, a challenge that DuPont believed it could prepare for by careful study of the markets and thoughtful planning.
The notion of economic, social, or urban planning that is familiar today was a relatively new and highly contested practice in the United States during this period. President Franklin D. Roosevelt’s New Deal introduced the idea of national economic planning to the American people. At the same time, urbanists promoted urban and regional planning to remedy the challenges facing growing cities across the U.S. But for all its advocates, planning also had plenty of detractors, including those who believed it to be fundamentally undemocratic or antithetical to capitalism.
Records from DuPont’s Post War Planning Division, which are found among the papers of Harry Haon II, a lifelong DuPont employee, provide a snapshot of the wartime debates on planning in the United States. Haon, trained as a chemist but ultimately worked on the company’s sales and marketing efforts, collected a wide range of publications on the topic, everything from government pamphlets to marketing trade journal articles. As a historian of graphic design and data visualization, my primary interest in this material lies in the charts and graphs that frequently appear in these papers.
(Harry J. Haon family papers, Hagley Museum & Library)
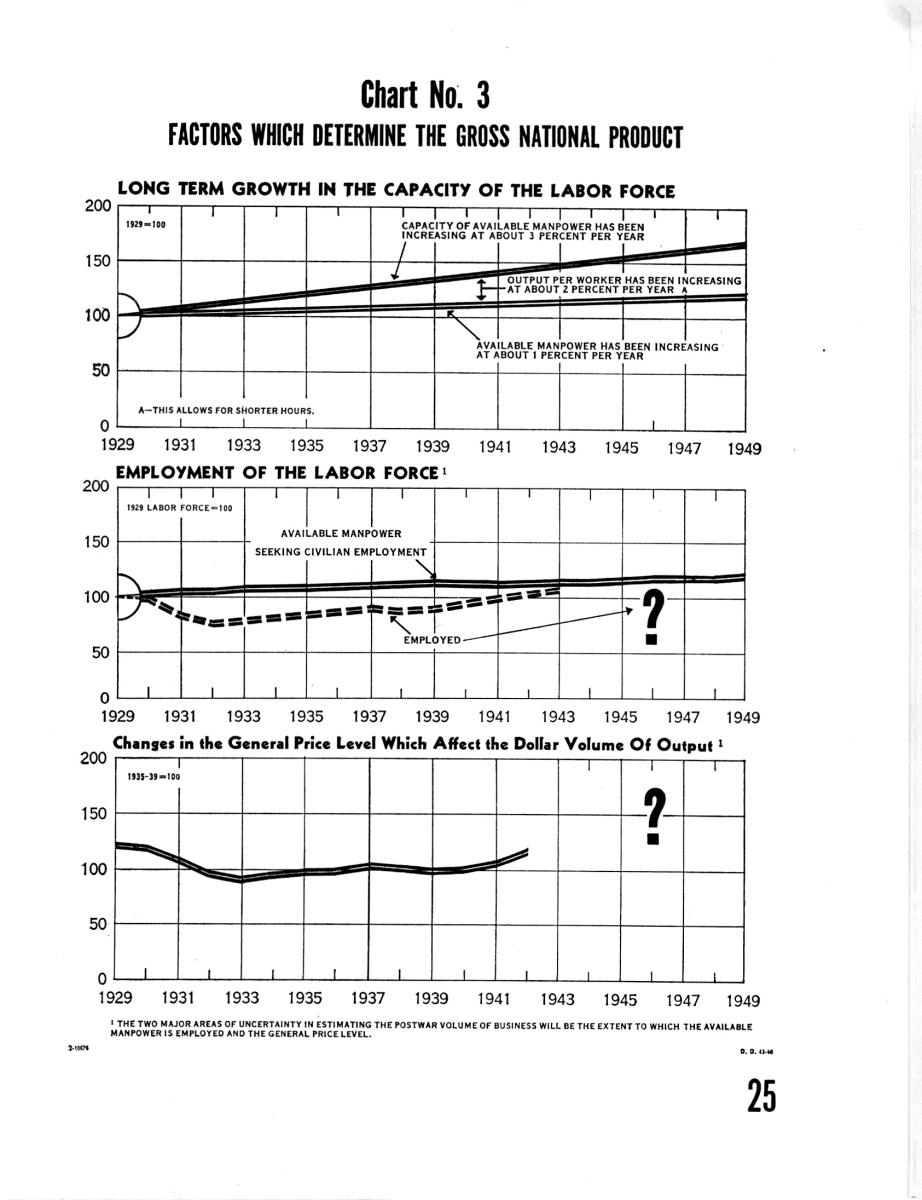
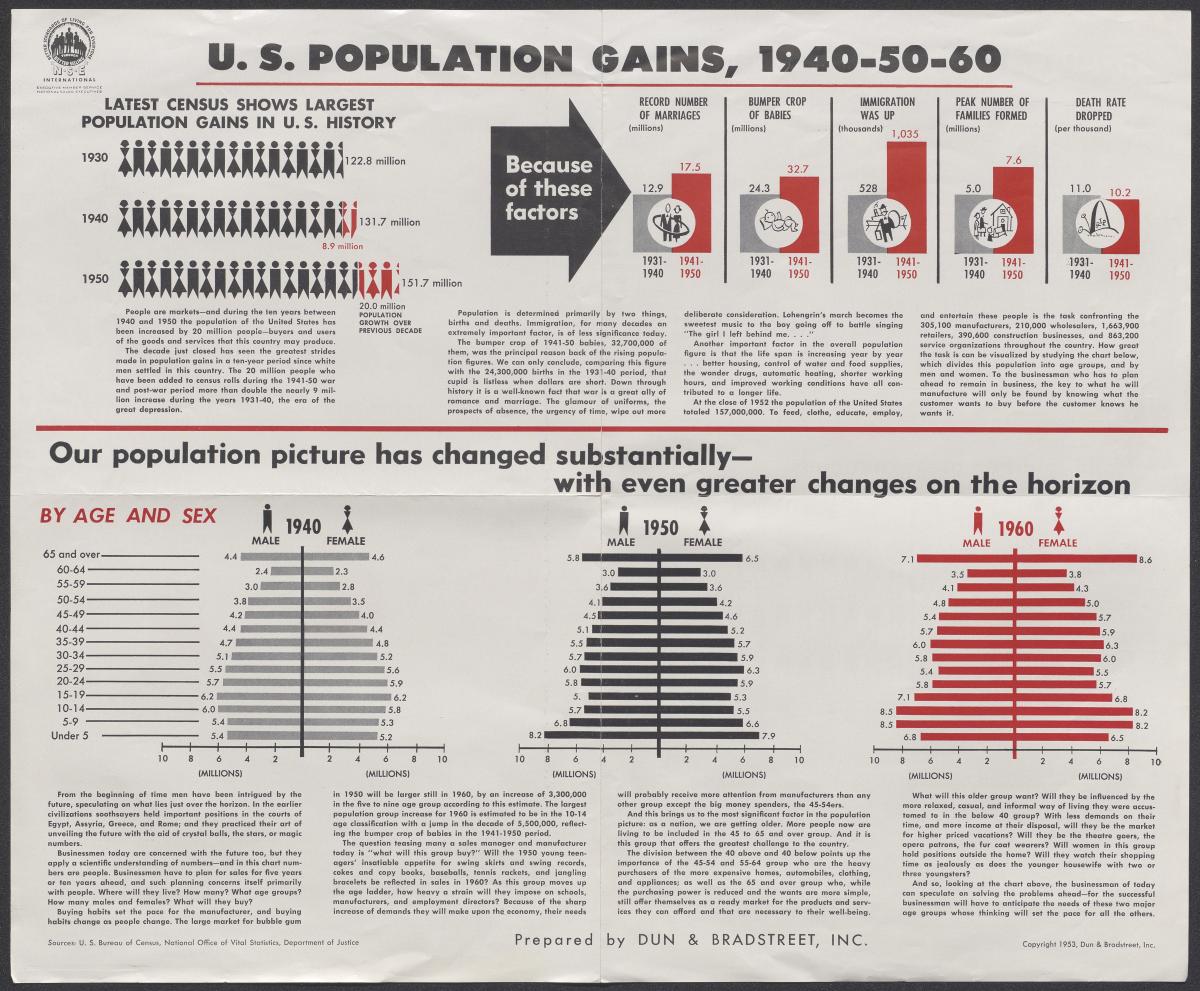 These images form part of a broader trend in the period, namely the increasing use of graphic methods to visualize economic and social statistics in various arenas, including business. The statistical graphics found in publications on planning are especially compelling because they don’t just show past and present data but also frequently display predictions about the future. These predictions are visually distinguished from collected data in subtle and not-so-subtle ways. For instance, in “Markets After the War,” a pamphlet published by the U.S. Committee for Economic Development around 1943, a series of charts concerning factors that impact the Gross National Product present some of the graph’s curves as confident forecasts, while others end abruptly, their uncertainty marked with prominent question marks. Similarly, in a 1953 brochure from the private PR firm Dun & Bradstreet, Inc., past and present population data appears in black ink, while the future—specifically the year 1960—appears in red. These images thus use the basic building blocks of graphic design—line, shape, color, and type— to differentiate between collected and predicted data, i.e., the known and the unknown.
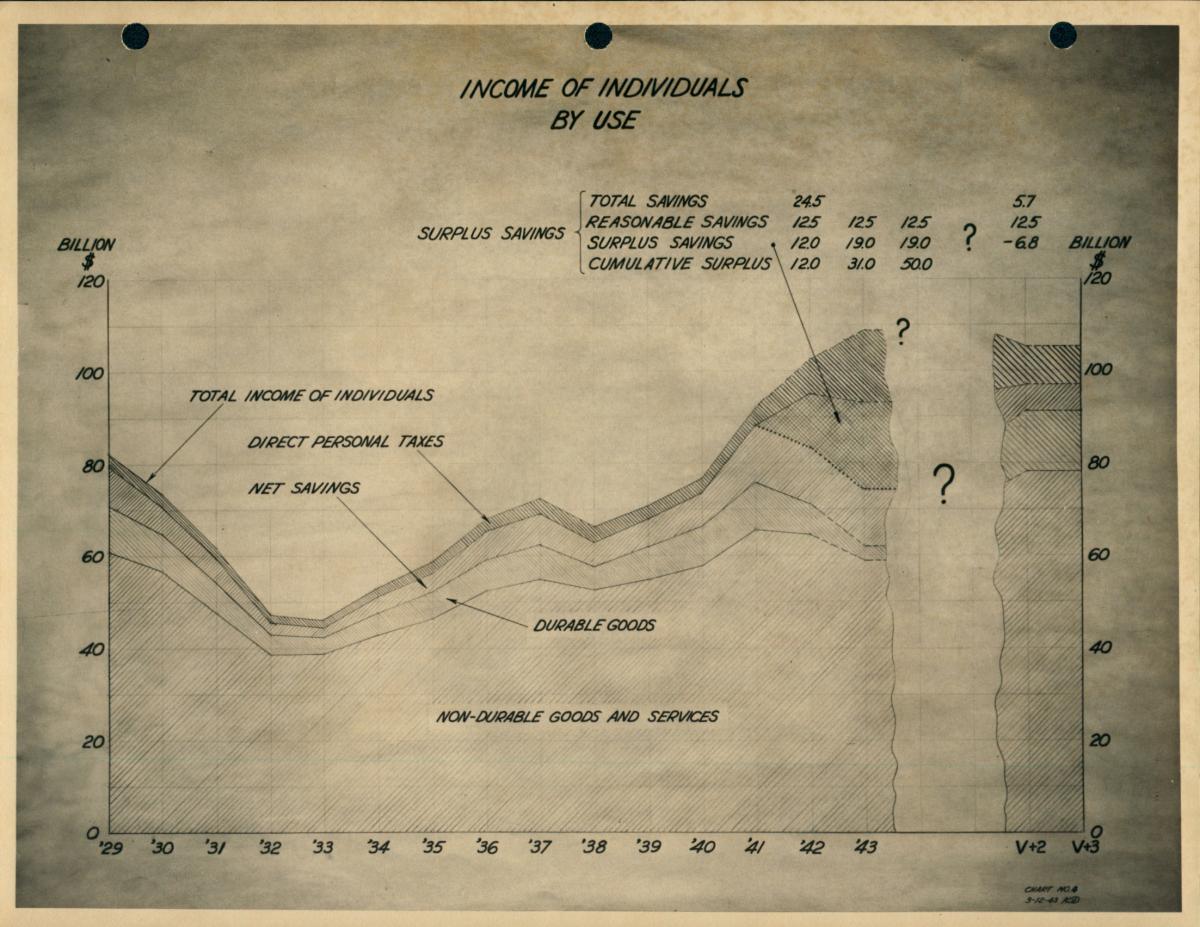 Similar strategies are found in the materials on post-war planning that the DuPont Post War Planning Division itself produced. A series of presentation charts made around 1943 gives a sense of the factors the company considered as it prepared for peacetime. With charts on national income, individual income, consumer spending, and more, the series attempts to make sense of who will have money and what they will spend it on. But a certain degree of uncertainty inevitably persists, marked, for instance, in a chart on “Income of Individuals by Use” by a gap in the graph that appears like a canyon of doubt, in which floating question marks replace data. Again, the difference between the known and the unknown is visualized in this image.
By studying the production and use of charts by DuPont and others who were looking at and preparing for the future, I aim to unpack connections between planning, business, statistical representation, and graphic design in this period to understand how uncertainty was navigated, both on the page and off.
Hannah Pivo is a Ph.D. candidate in the Department of Art History and Archaeology at Columbia University and a grant recipient from Hagley Museum & Library’s Center for the History of Business, Technology, and Science. She works on 19th and 20th century design history, with a focus on graphic design and the visual representation of information. Her dissertation addresses the use of statistical graphics in discourses of planning—economic, urban, and corporate— in the United States in the first half of the 20th century.